Newsletter
June 2026
Top Heavy
Since the end of COVID, equity markets have become increasingly concentrated. This iteration centers on AI–related companies, which now represent a significant share of the S&P 500's market capitalization and, as a result, have an outsized influence on index performance. While the deployment of AI will take time, and its ultimate benefits and consequences have yet to fully emerge, the market has already divided businesses into two categories: definite winners and potential losers. This has fueled the meteoric rise of some stocks while leaving others languishing in relative purgatory.
The following piece from RBC Wealth Management, written by Tyler Frawley, CFA captures the essence of what we are observing and highlights the challenges of navigating this environment.
The "Great Narrowing": S&P 500 Concentration
Over the past decade, the S&P 500, which has historically been viewed as a balanced cross-section of the U.S. economy, has slowly transformed into a tech- and AI-dominated index. As 2026 begins with markets near record highs, we believe this "Great Narrowing" should be top of mind for investors.
Evolution of dominance: From 1990 to the AI era
In 1990, the S&P 500 looked like a far more representative cross-section of the U.S. economy. The 10 largest companies by market cap (including IBM, Exxon, General Electric, and Philip Morris) made up roughly 19 percent of the index. Leadership was spread across multiple sectors, and no single industry dominated overall returns.
That began to change during the late-1990s technology boom. By the end of 2000, the top 10 accounted for roughly 23 percent of the index (with concentration peaking during the year at about 27 percent), driven by the rise of companies such as Cisco, Microsoft, and Intel. The subsequent unwind was sharp, and the early-2000s reset led to a period where concentration declined as energy and consumer stocks regained prominence.
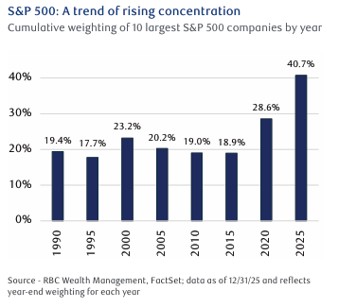 A more durable shift began after the 2008 financial crisis with the rise of the platform economy, defined by software, cloud computing, and digital advertising, which created business models capable of scaling with minimal marginal cost. Even then, concentration remained relatively modest for a time. By the end of 2015, the top 10 stocks accounted for about 19 percent of the S&P 500's weight and roughly 19 percent of total index earnings, suggesting to us that market value and fundamentals were broadly aligned. That balance has changed meaningfully over the past decade. By the end of 2025, the 10 largest companies accounted for nearly 41 percent of the S&P 500's total weight, more than doubling in just 10 years.
Valuation and performance disparity between cap-weighted and equal-weighted indexes
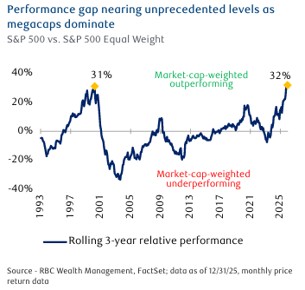
The effects of rising concentration are most visible when comparing the market-cap-weighted S&P 500 to the S&P 500 Equal Weight Index, which assigns each constituent an equal (about 0.2 percent) allocation. From 2003 through 2022, the equal-weighted index outperformed the cap-weighted index by roughly 1.5 percent per year, reflecting size effects and
periodic mean reversion among large-cap leaders. However, this relationship has broken down meaningfully since the beginning of 2023, and over the past three years the market-cap-weighted S&P 500 has outperformed.
It's equal-weighted counterparts by roughly 32 percent. This represents one of the largest three-year relative outperformances on record, exceeding the approximately 31 percent outperformance observed in the late 1990s and early 2000s in the run-up to the tech bubble.
The outperformance has coincided with a dramatic widening of the valuation gap, as the market-cap-weighted S&P 500 now trades at a nearly 30 percent premium to its equal-weighted counterpart, up from approximately 13 percent just prior to the pandemic, and sharply higher than the near-parity levels seen a decade ago.
This reflects, in part, how index concentration has risen significantly faster than earnings contribution. In 2025, the top 10 stocks represented roughly 41 percent of the index's total weight but were expected to generate only about 32 percent of its earnings. That gap has widened meaningfully since 2015, when weight and earnings contribution were more closely aligned. While the largest companies remain highly profitable, market value concentration has increasingly run ahead of fundamental profitability.
Concentration doesn't automatically mean a bubble.
It is important to acknowledge that today's concentration is not purely speculative, and, unlike prior market peaks, the largest constituents of the S&P 500 are highly profitable businesses with strong balance sheets, durable competitive advantages, and substantial free cash flow generation. Many are returning capital to shareholders while continuing to invest heavily in growth, particularly in AI-related products and infrastructure.
 Elevated concentration alone is not sufficient evidence of a bubble. Market leadership has narrowed in part because earnings, margins, and cash flow have narrowed. That distinction matters and helps explain why valuations have been elevated for longer than many investors anticipated.
The risks of a top-heavy market
Even so, we believe the current structure introduces several risks worth monitoring.
First, idiosyncratic shock risk is materially higher. In 1990, an earnings miss at a top holding would have had a limited index-level impact. Today, with NVIDIA alone representing nearly eight percent of the index, a single company can meaningfully influence index returns, affecting portfolios that assume broad diversification.
Second, there is the passive concentration trap. Many investors believe an S&P 500 fund offers wide diversification. But, more than $40 of every $100 invested flows into just 10 companies, creating a feedback loop where passive inflows disproportionately support the largest stocks, increasing their weights and reinforcing performance leadership regardless of fundamentals.
Third, correlation risk tied to AI exposure has increased. Unlike past periods when the top 10 spanned unrelated industries, today's leaders are closely linked by a common theme—AI. That effectively turns the index into a directional bet on AI adoption and monetization. If expectations slip or timelines extend, there are fewer offsetting exposures within the index to absorb the impact.
What does this mean for investors?
The "Great Narrowing" of the S&P 500 reflects a structural shift, where a handful of technology- and AI-driven giants now dominate the index's composition, performance, and risk profile. While current leaders boast robust fundamentals, strong profitability, competitive advantages, and growth trajectories, the sheer concentration of market value in a narrow cohort introduces new risk. The disconnect between weight and earnings contribution, the outsized influence of individual stocks, and passive inflows amplifying this dynamic underscore a critical reality—what appears as broad diversification increasingly functions as a concentrated allocation in a single thematic outcome. For investors, this evolution requires a recalibration of assumptions. The index has been a resilient benchmark, but its top-heavy structure warrants scrutiny. Understanding embedded risks, from idiosyncratic volatility to thematic correlation, is more essential than ever, in our view.